April 2026 Cycle Report
Published 15 April 2026
🤖 Algorithm endpoints
In continuation of our work on the algorithm invoke method (see our previous blog post), we have now implemented the backend changes required to launch algorithm endpoints. These endpoints host the algorithm container on GPU-enabled infrastructure and allow the algorithm to be invoked multiple times. Next, we will work on the invocation model to enable and manage these invocations.
🔍 Finding Your Work Just Got Easier
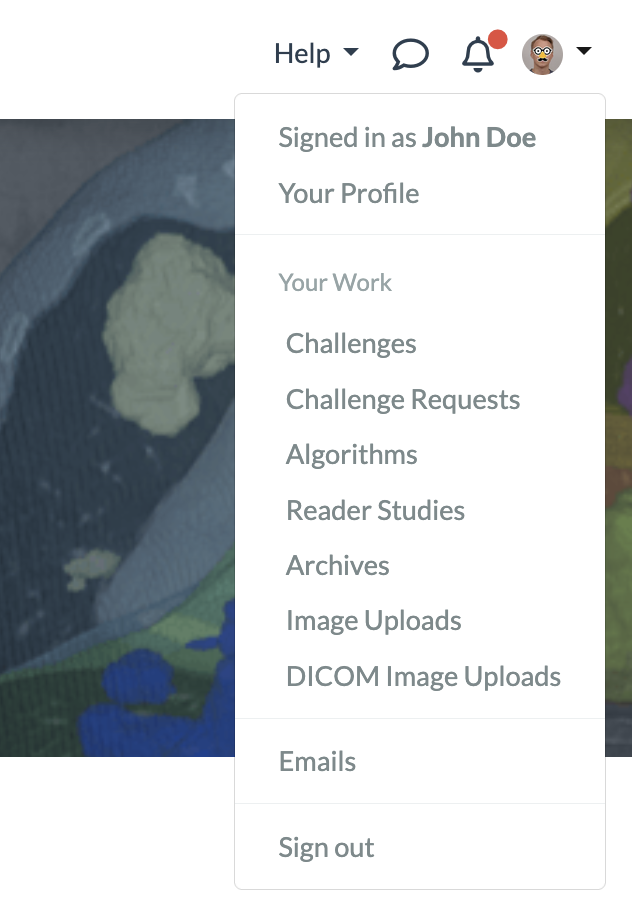
Locating a specific challenge, reader study, archive, or algorithm in the long list can be time-consuming. To address this, we've added a 'Your Work' section to the main dropdown menu. This section displays all items for which you have a user, editor, or admin role, and lets you sort them by title, creation date, role, and more — so you can quickly find exactly what you're looking for.
🧪 Proof of concept for rendering a million annotations in client side pathology viewer
This cycle we worked on building a proof of concept to support loading more than a million annotations in our clientside pathology viewer. We implemented a WebGL approach that is able to render the annotations in realtime. The annotations will be highlighted when hovered and their label will be shown. Bidirectional highlighting is active so that hovering an individual annotation in the sidebar will highlight it in the viewer and vice versa. The individual subannotations are not listed in the sidebar when their count exceeds 1,000, because this would generate an unwieldly list. Currently, the proof of concept is only implemented for point annotations shown for an algorithm job or archive item.
⏱️ Annotations with time components
It is now possible to create polygonal annotation types on 4d images which will also have a time-component to mark on which timepoint they were annotated:
This new feature is supported for all except the following annotation types:
- Point type annotations
- Two-line angle annotations
- Masks (these are not polygonal)
To activate the 4d-annotation mode, simply upload a timeseries-image to your reader study. When annotating on a 4d image, timepoint data will be activated automatically.
Resulting annotations will contain an extra time-component, for example:
{
  "name": "",
  "time_index": 0,
  "type": "Three-point angle",
  "angle": [...],
  "version": {...}
}

Cover photo by Kouji Tsuru on Unsplash
